
How Dense Is Narberth, Compared to Everyone Around It?
A data-first look at Narberth's population and housing density against Lower Merion Township, Montgomery County, and the Main Line's other town centers.

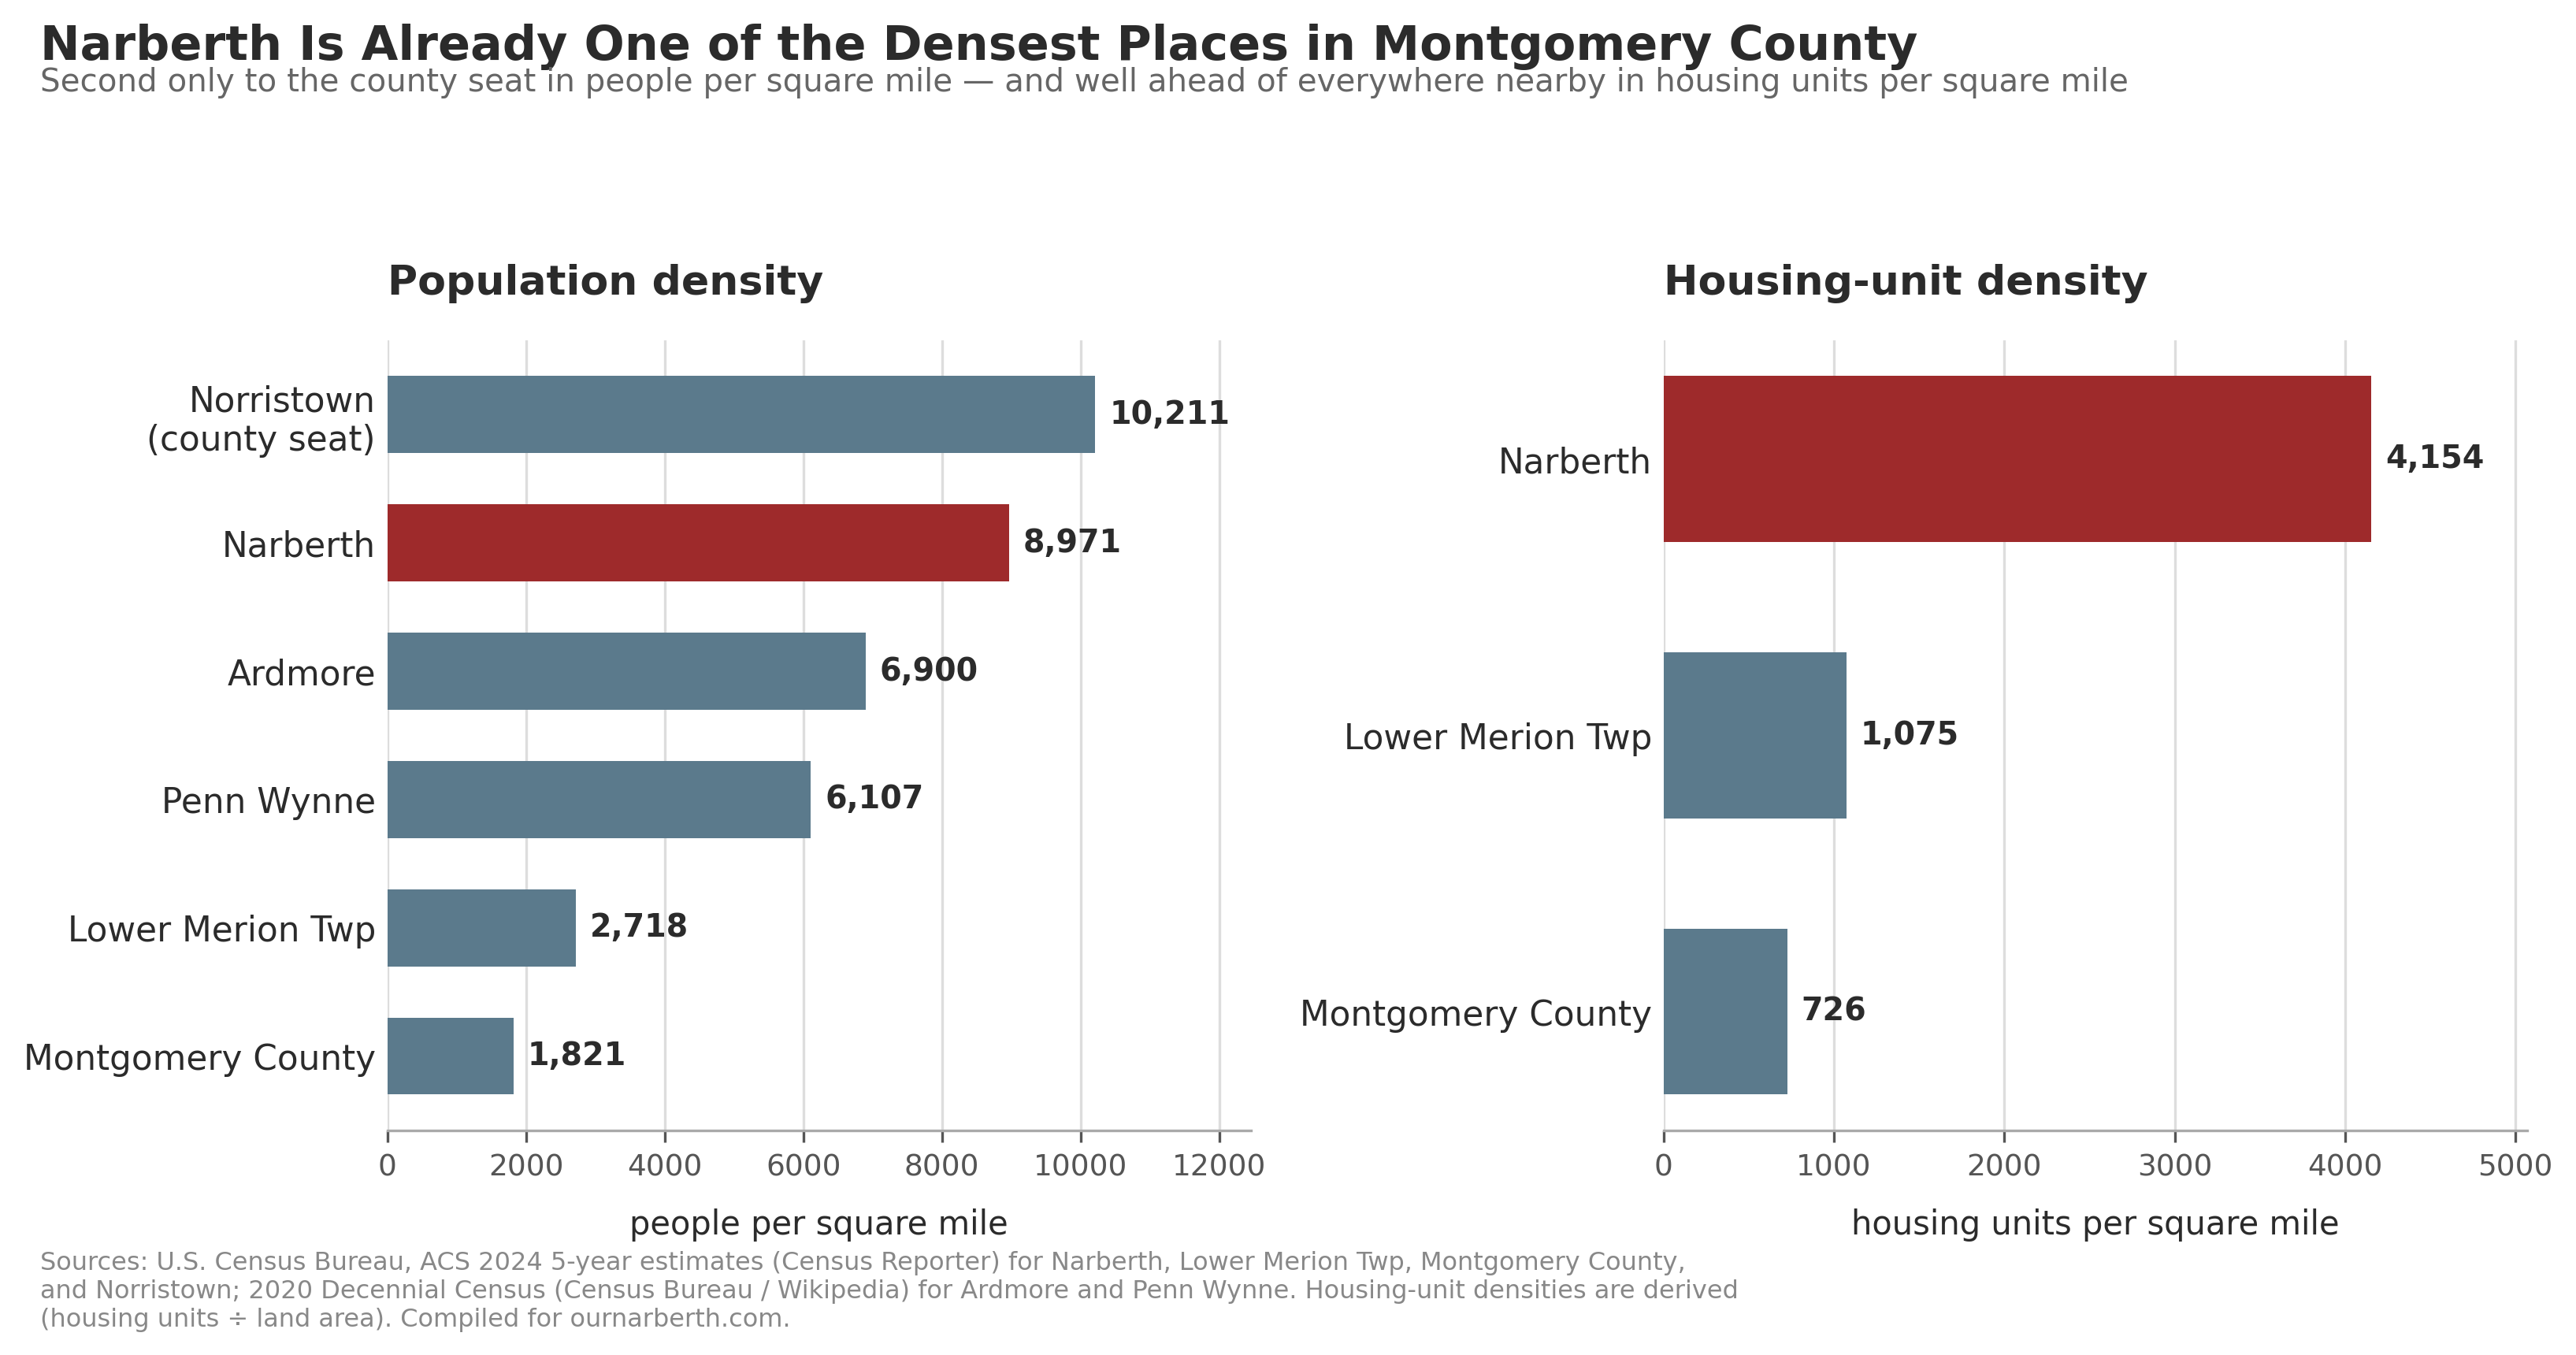
Narberth is already one of the densest places in Montgomery County, second only to the county seat in people per square mile, and far ahead of everywhere nearby in housing units per square mile. Here’s what the Census data actually shows.
Whenever the 4a and 5b zoning amendments come up, the conversation about density tends to stay in the abstract with “too much,” “out of character,” “exactly what transit-oriented development is supposed to look like.” Those are judgments. Underneath them is a narrower, answerable question: how dense is Narberth, right now, compared to the places around it?
Pulling the actual Census numbers gives a clearer, more nuanced, picture than anyone’s shorthand usually allows.
The numbers
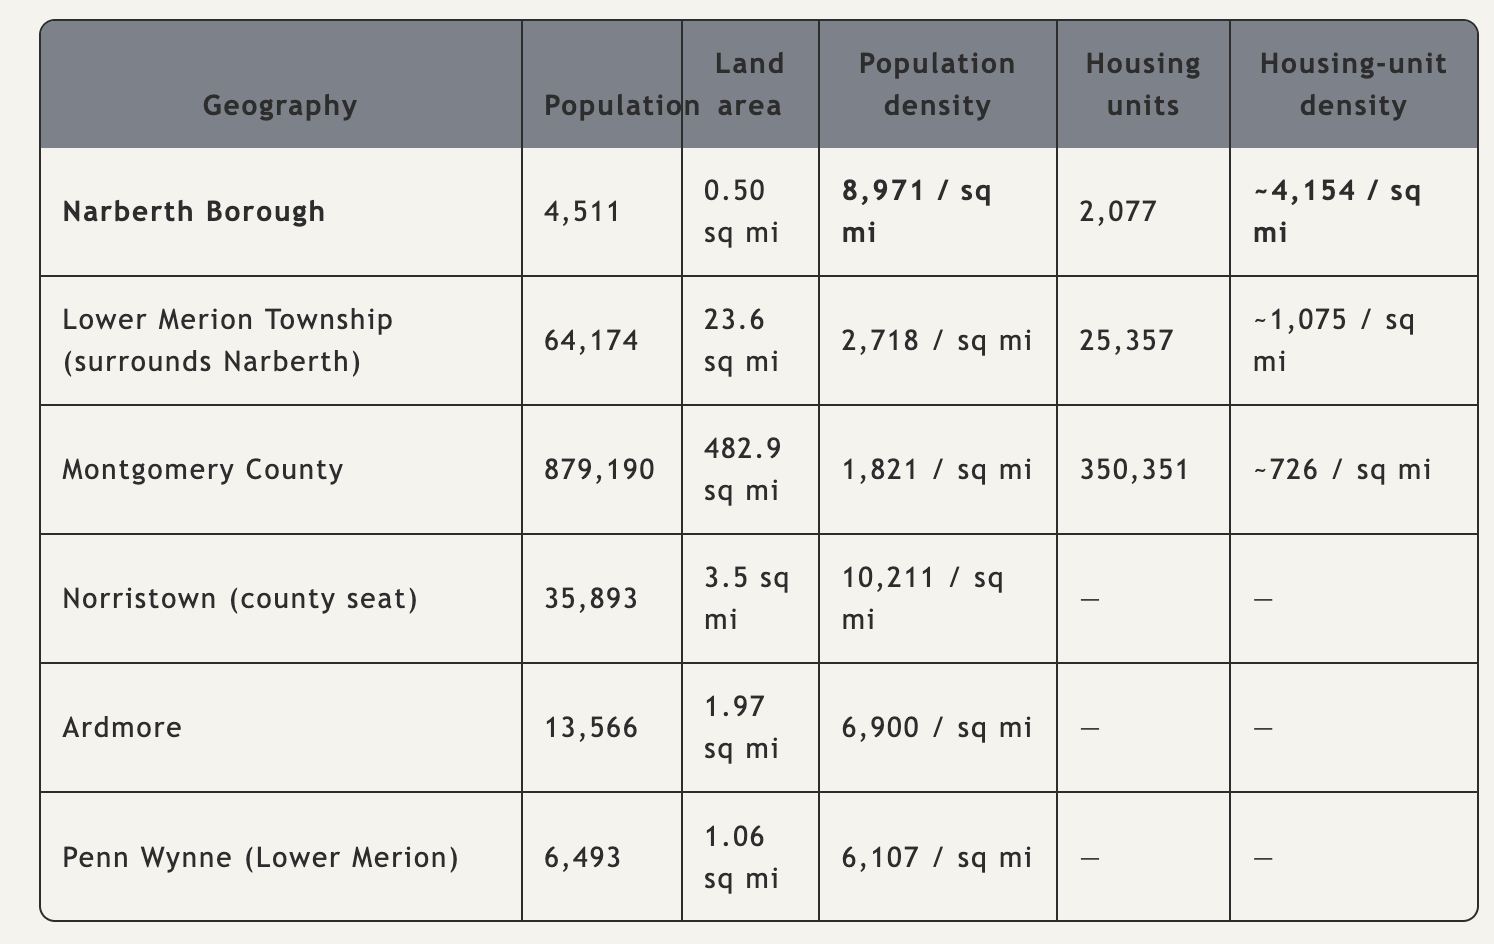
A few things jump out:
Narberth’s population density is 3.3 times Lower Merion Township’s and 4.9 times Montgomery County’s.
The housing-unit gap is wider still: 3.9 times Lower Merion’s housing density and 5.7 times the county’s. Narberth already has far more dwellings packed onto each acre than the township that surrounds it, let alone the county as a whole.
Among the Main Line’s other walkable town centers, Narberth is already denser than Ardmore and Penn Wynne, and trails only Norristown, the county seat, and the one place in Montgomery County built and zoned to function as a small city.
It’s not about bigger households
The easy assumption is that a denser place just has more people crammed into each house. That’s not what’s happening here. Narberth actually has fewer people per household (2.3) than Lower Merion Township (2.5) or the county as a whole (2.5).
The density comes from the built form, not from household size: smaller lots, more twins and attached housing, a tighter street grid, and a real walkable core — not from Narberth residents stacking more people into each unit than their neighbors do. That distinction matters for the zoning debates, because it means Narberth’s existing density is a product of how the town was built, not of crowding within the housing stock that’s already there.
Narberth vs. the county seat
The Norristown comparison is worth considering. Norristown is the county seat of Montgomery County — its largest borough, with a commercial downtown, county government offices, and a development pattern built around functioning as a small city. Its population density (10,211 per square mile) is the highest of any municipality in the county.
Narberth, a half-square-mile residential borough with no comparable commercial or institutional core, already sits at 8,971 thats within shouting distance of Norristown, and well clear of everywhere else on this list. That’s a half-square-mile town carrying density most of the region only sees in places built to be regional centers.
Narberth is already carrying a disproportionate share of the region’s housing and population density relative to its neighbors. Whether that means the borough has already done its part, or that it’s well-positioned to do more, is a judgment about values and tradeoffs. It’s not something the density numbers settle on their own. The 4a and 5b zoning amendments will move Narberth more closely to a city density like that of Norristown but without the city plan or regional support. Parking, sewage treatment, run off, water and utilities will all become pressure points. The borough has not shown the maturity of purpose and discipline to execute successfully under these constraints.
Methodology notes
Population, land area, and housing-unit figures for Narberth Borough, Lower Merion Township, Montgomery County, and Norristown are American Community Survey 2024 5-year estimates, via the U.S. Census Bureau and Census Reporter. Ardmore and Penn Wynne figures are from the 2020 Decennial Census, a different data vintage included for additional regional context rather than a strict apples-to-apples comparison. Housing-unit density figures are derived by dividing housing units by land area; they are not directly published by the Census Bureau and carry the same margins of error as the underlying ACS estimates. All figures reflect Census-defined municipal or place boundaries, not school district or zip code boundaries, which can differ.